| Company Insights Wed. May 6, 2026 Nvidia Microsoft Apple Alphabet Amazon Meta Tesla ● Earningd Releases | Uptrend Companies | Downtrend Companies |
|---|
| Company | Ticker | Price | Change | Trend | Std
Dev | Level |
|---|
| SanDisk Corp | SNDK | $1409.98 | 0.26% | 9.5 | 11.58% | 109 | | Intel | INTC | $113.01 | 4.46% | 9.5 | 14.5% | 102 | | Advanced Micro Devices | AMD | $421.466 | 18.64% | 9.5 | 11.38% | 110 | | Micron Technology | MU | $666.8 | 4.11% | 9.5 | 9.88% | 114 | | QUALCOMM | QCOM | $192.662 | 3.27% | 9.5 | 10.56% | 104 | | Seagate Technology | STX | $786.42 | 2% | 9.5 | 11.31% | 102 | | Quanta Services | PWR | $785.285 | 1.8% | 8.5 | 8.55% | 102 | | Circle Internet Group | CRCL | $121.795 | 6.76% | 8.1 | 7.69% | 104 | | Western Digital | WDC | $483.15 | 3.85% | 7.3 | 8.05% | 106 | | Ciena Corp | CIEN | $576.59 | 5.89% | 6.2 | 4.73% | 114 |
| | Company | Ticker | Price | Change | Trend | Std
Dev | Level |
|---|
| Cencora | COR | $252.59 | -17.39% | -6.8 | 5.96% | -47 | | Arista Networks | ANET | $147.011 | -13.68% | -4.3 | 6.97% | 8 | | McKesson | MCK | $743.52 | -7.15% | -3.8 | 4.14% | -25 | | Stryker | SYK | $292.23 | -1.04% | -3.5 | 6.21% | 5 | | AST SpaceMobile | ASTS | $70.68 | 10.66% | -3.2 | 13.44% | 25 | | L3Harris Technologies | LHX | $302.21 | -0.11% | -3 | 6.33% | 9 | | Meta Platforms Inc. | META | $612.88 | 1.31% | -2.8 | 4.59% | 17 | | Abbott Laboratories | ABT | $86.245 | -1.06% | -2.6 | 5.72% | 10 | | Boston Scientific | BSX | $56.01 | 0.07% | -2.4 | 5.7% | 13 | | Palantir | PLTR | $133.787 | -1.56% | -2.2 | 4.49% | 22 |
| | | |
| | ● Netflix at $100.24: What Happened on December 5 and What’s Next? | 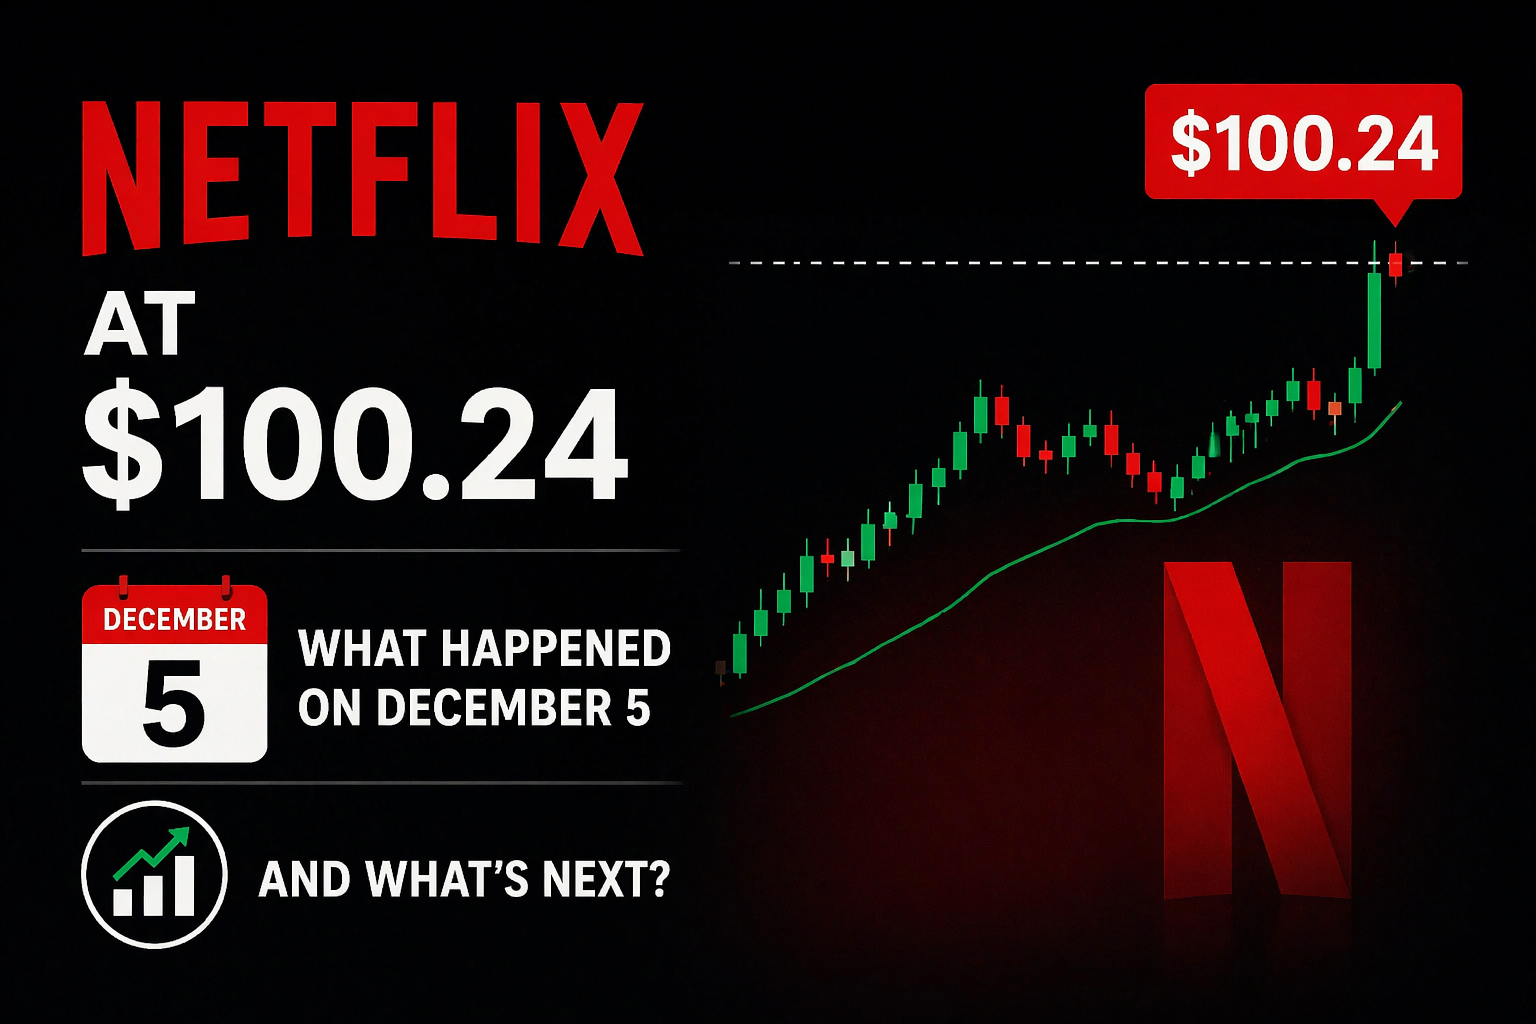 | With directional probability better than -20% and price closer to a possible short-term bottom
Sun. Dec 7, 2025
|
| | ● META’s wobble looks like a bottom: why I’m leaning long (with eyes open) | 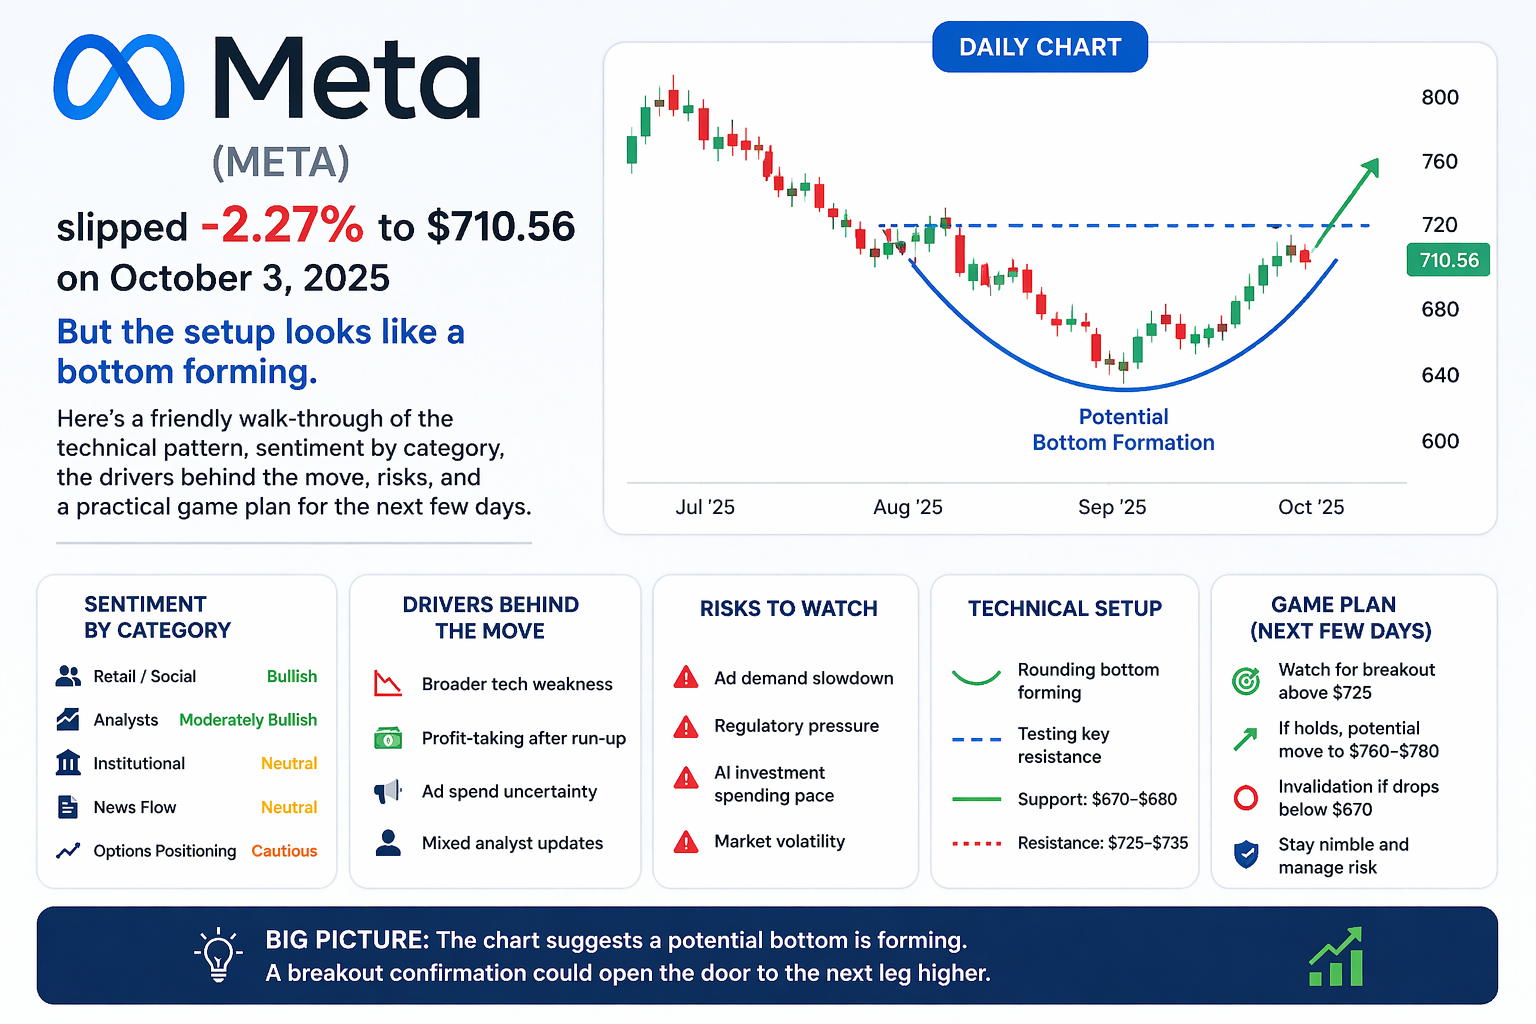 | Meta (META) slipped 2.27% to $710.56 on October 3, 2025, but the setup looks like a bottom forming. Here’s a friendly walk-through of the technical pattern, sentiment by category, the drivers behind the move, risks, and a practical game plan for the next few days.
Sun. Oct 5, 2025
|
| | ● From Lab Bench to Breakout: Why Thermo Fisher (TMO) Just Popped |  |
Wed. Oct 1, 2025
|
| | ● NVDA: A Bottom Taking Shape — Why a Near-Term Long Is Back on the Table | 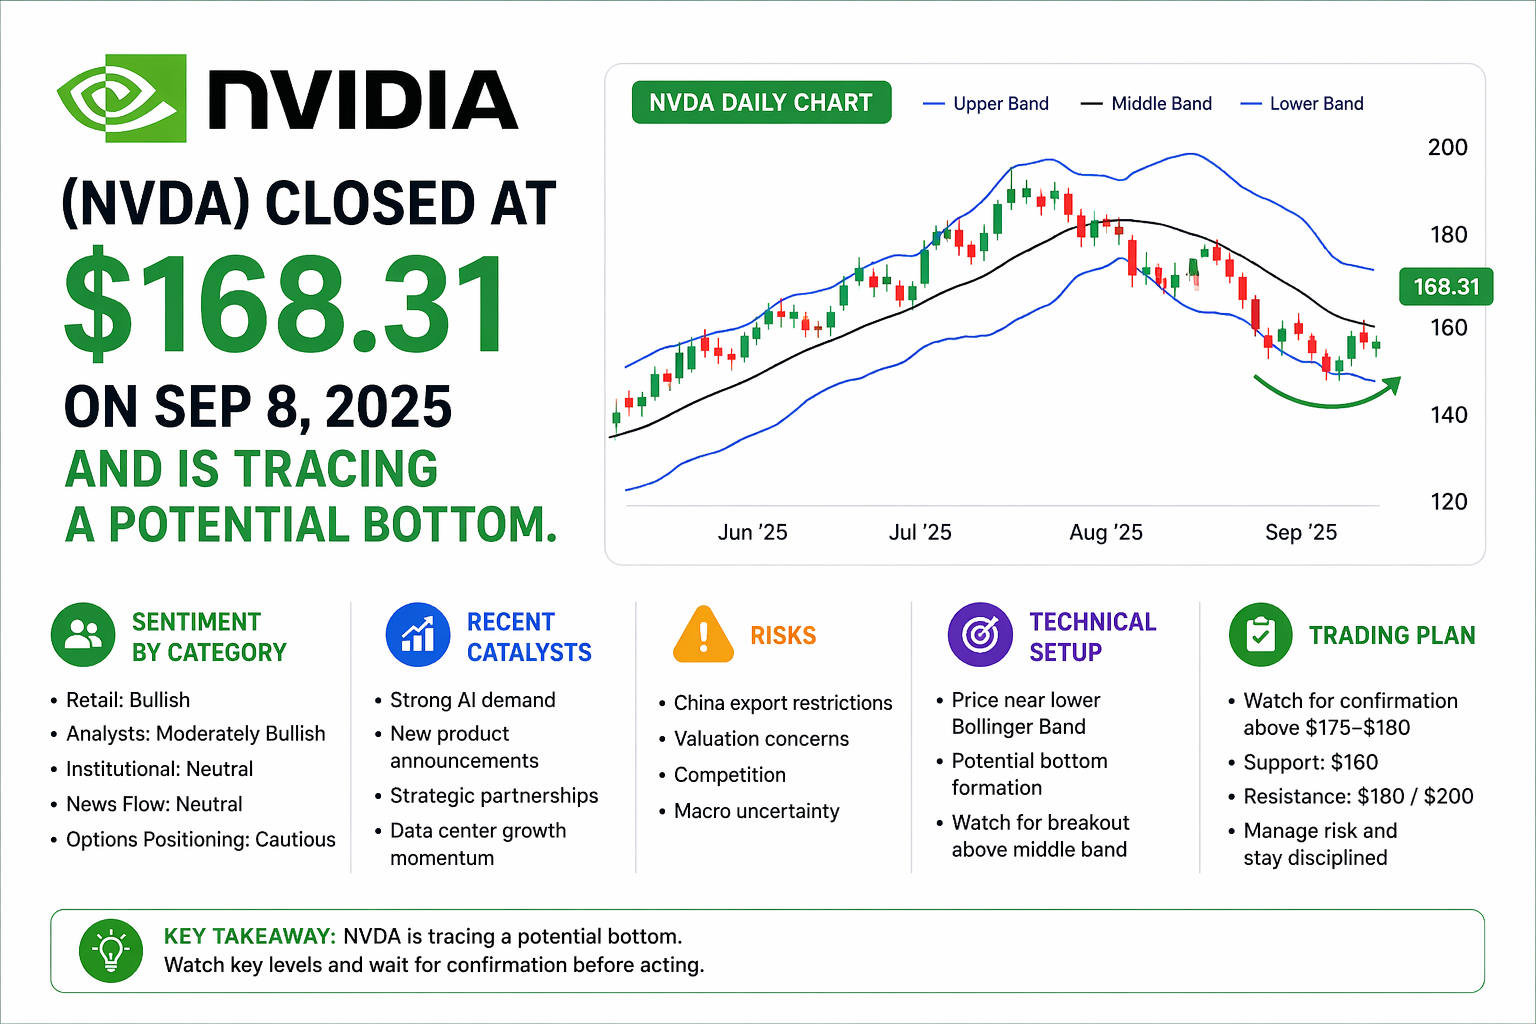 | NVIDIA (NVDA) closed at $168.31 on Sep 8, 2025 and is tracing a potential bottom. This piece reviews the technical setup with a Bollinger-Band chart, category-level sentiment, recent catalysts, risks, and a disciplined trading plan for the near term.
Mon. Sep 8, 2025
|
| | ● Intel’s Bottoming Signal: Why INTC Looks Buyable After a Rough Day | 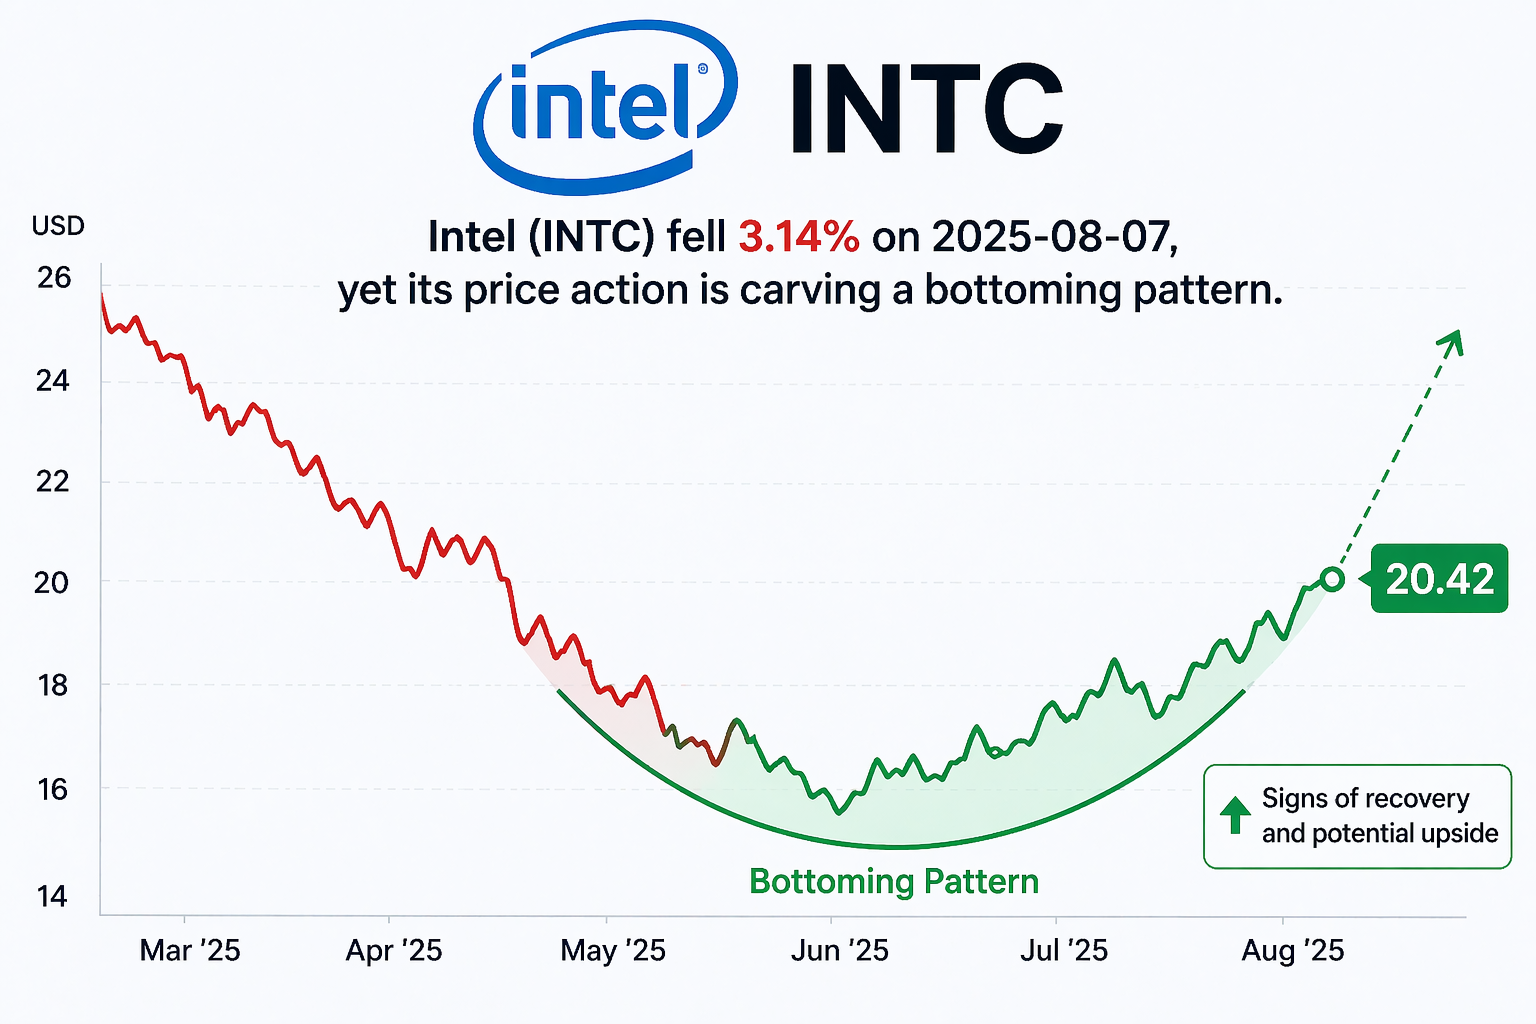 | Intel (INTC) fell 3.14% on 2025-08-07, yet its price action is carving a bottoming pattern. Here’s a friendly, data-backed walkthrough of the setup, sentiment, key events, near-term outlook, risks, and a simple trading plan—plus interactive charts to explore.
Thu. Aug 7, 2025
|
About
Contact Us
Copyright ©2025 TheMarketUnfolds. All rights reserved. Denver, Colorado, USA
|